The evolutionary distance between a pair of sequences is usually measured by the number of nucleotide or amino acid substitutions between them. Evolutionary distances are fundamental for the study of molecular evolution and are useful for phylogenetic reconstruction and estimation of divergence times. In MEGA, most of the widely used methods for distance estimation for nucleotide and amino acid sequences are included. In the following, they are presented in three sections: nucleotide substitutions, synonymous-nonsynonymous substitutions, and amino acid substitutions. For advice in the use of these methods, see Guidelines for Choosing Distance Measures in section 4.4. The treatment of alignment gaps and missing-information sites in distance computation is explained in section 4.5.
The evolutionary distances that are computed from DNA sequence data are primarily estimates of the number of nucleotide substitutions per site (d) between two sequences. There are many methods for estimating evolutionary distances, depending on the pattern of nucleotide substitutions (see Nei 1987, Gojobori et al. 1990, Saccone et al. 1990, and others). Here we have included only methods that are relatively simple and frequently used by molecular evolutionists. Two methods, i.e., the Tamura and Tamura-Nei methods, are new and their utility has not been well tested, but they are included here because they seem to be useful for analyzing mitochondrial DNA data, which are now often used for phylogenetic inference. In the following we first present the simplest method and then discuss gradually more complicated ones.
This distance is merely the proportion (p) of nucleotide sites at which the two sequences compared are different. This is obtained by dividing the number of nucleotide differences (nd) by the total number of nucleotides compared (n). Thus,
| p = nd/n. | (4.1) |
| V(p) =[p(1 -p)]/n. | (4.2) |
Under certain circumstances, one may want to compute the proportion of sites with transitional and transversional nucleotide differences. In MEGA, the proportions of transitional differences (P) and transversional differences (Q) are computed by
| P = ns/n and Q = nv/n, | (4.3) |
| Rd = P/Q, | (4.4) |
| V(Rd ) = [c12P + c22Q - (c1P + c2Q)2]/n, | (4.5) |
This method (Jukes and Cantor 1969) was developed under the assumption that the rate of nucleotide substitution is the same for all pairs of the four nucleotides A, T, C, and G (see Table 4.1), and it gives a maximum likelihood estimate of the number of nucleotide substitutions (d) between two sequences. It is given by
| d = -3loge(1 - 4p/3)/4 , | (4.6) |
| V(d) = p(1 -p)/[(1 - 4p/3)2n] | (4.7) |
The Jukes-Cantor distance can be computed if p < 0.75; otherwise it is not applicable because the argument of the logarithm becomes negative. This distance gives a good estimate of the number of nucleotide substitutions if (1) the frequency of each nucleotide is close to 0.25, (2) there is no transition/transversion bias (i.e., the transition/transversion ratio is nearly equal to 0.5), and (3) d is not very large (say d < 1.0). However, when the number of nucleotides examined is small, say n < 100, the Jukes-Cantor distance tends to give overestimates of the true number of nucleotide substitutions (Tajima 1993).
| Original | Mutant | |||
| A | T | C | G | |
| A. Jukes-Cantor model | ||||
| A | - | l | l | l |
| T | l | - | l | l |
| C | l | l | - | l |
| G | l | l | l | - |
| l is the rate of substitution. | ||||
B. Tajima-Nei model | ||||
| A | - | b | g | d |
| T | a | - | g | d |
| C | a | b | - | d |
| G | a | b | g | - |
| a, b, g, and d are the rates of substitution. | ||||
C. Kimura 2-parameter model | ||||
| A | - | b | b | a |
| T | b | - | a | b |
| C | b | a | - | b |
| G | a | b | b | - |
| a and b are the rates of transitional and transversional substitution, respectively. | ||||
D. Tamura model | ||||
| A | - | (1-q)b | qb | qa |
| T | (1-q)b | - | qa | qb |
| C | (1-q)b | (1-q)a | - | qb |
| G | (1-q)a | (1-q)b | qb | - |
| a and b are the rates of transitional and transversional substitution, respectively, and q is the G+C content. | ||||
E. Hasegawa et al. model | ||||
| A | - | gTb | gCb | gGa |
| T | gAb | - | gCa | gGb |
| C | gAb | gTa | - | gGb |
| G | gAa | gTb | gCb | - |
| a and b are the rates of transitional and transversional substitution, respectively, and gi denotes nucleotide frequencies (i = A, T, C, G). | ||||
F. Tamura-Nei model | ||||
| A | - | gTb | gCb | gGa1 |
| T | gAb | - | gCa2 | gGb |
| C | gAb | gTa2 | - | gGb |
| G | gAa1 | gTb | gCb | - |
| a1 and a2 are the rates of transitional substitution between purines and between pyrimidines, respectively, b is the rate of transversional substitution, and gi denotes nucleotide frequencies (i = A, T, C, G). | ||||
In real data, nucleotide frequencies often deviate substantially from 0.25. In this case the Tajima-Nei distance (Tajima and Nei 1984) gives a better estimate of the number of nucleotide substitutions than the Jukes-Cantor distance. This estimator is based on the equal-input model of Nei and Tajima (1981) (see Table 4.1). The estimator (d) and its variance [V(d)] are given by the following equations.
| d = -b loge(1 -p/b), | (4.8) |
| V(d) = p(1 -p)/[(1 - p/b)2n], | (4.9) |
In actual sequence data the rate of transitional nucleotide substitution is often higher than that of transversional substitution. This is particularly so for animal mitochondrial DNA (Brown et al. 1982). In this case, the Jukes-Cantor distance is expected to give an underestimate of d unless d is quite small, say d < 0.1. A maximum likelihood estimate of d for this case is given by Kimura's (1980) 2-parameter method (Table 4.1). This estimate and its variance are given by
| d = -loge(1 - 2P - Q)/2 -loge(1 - 2Q)/4, | (4.10) |
| V(d) = [c12P + c32Q - (c1P + c3Q)2]/n, | (4.11) |
With Kimura's model, it is possible to compute the numbers of transitional (s) and transversional (v) nucleotide substitutions per site and their variances.
Transitional substitutions:
| s = -loge(1 - 2P - Q)/2 + loge(1 - 2Q)/4, | (4.12) |
| V(s) = [c12P + c42Q - (c1P + c4Q)2]/n, | (4.13) |
Transversional substitutions:
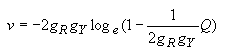
| v = -loge(1 - 2Q)/2, | (4.14) |
| V(v) = c22Q(1 - Q)/n. | (4.15) |
Transition/transversion ratio (R = s/v):
The ratio (R) of the number of transitional substitutions (s) to that of transversional substitutions (v) is called the transition/transversion ratio. Note that R is different from Rd defined earlier. In the present case, R and its variance [V(R)] are given by
| R = loge(1 - 2P - Q)/loge(1 - 2Q) -1/2, | (4.16) |
| V(R) = [c52P + c62Q - (c5P + c6Q)2]/n, | (4.17) |
| d = -2q(1 - q)loge(1 - P/[2q(1 - q)] - Q) -[1 -2q(1 -q)]loge(1 - 2Q)/2, | (4.18) |
| V(d) = [c12P + c32Q - (c1P + c3Q)2]/n, | (4.19) |
The estimates of the numbers of transitional (s) and transversional (v) substitutions per site are obtained by the following equations.
Transitional substitutions:
| s = -2q(1 - q)loge(1 - P/[2q(1 - q)] - Q) + q(1 - q)loge(1 -2Q), | (4.20) |
| V(s) = [c12P + c42Q - (c1P + c4Q)2]/n, | (4.21) |
Transversional substitutions:
| v = -loge(1 - 2Q)/2, | (4.22) |
| V(v) = c22Q(1 - Q)/n. | (4.23) |
Transition/transversion ratio (R = s/v):
| R = 4q(1 - q)loge(1 - P/[2q(1 - q)] - Q)/loge(1 - 2Q) - 2q(1 - q), | (4.24) |
| V(R) = [c52P + c62Q - (c5P + c6Q)2]/n, | (4.25) |
In MEGA, the average G+C content for the pair of sequences compared is used for q. Therefore, different pairwise comparisons may have different values of q. There are other ways of computing q, but the distance estimates obtained are usually very similar.
One of the useful mathematical models for analyzing mitochondrial DNA is that of Hasegawa et al.'s (1985). This model (Table 4.1) has been used for phylogenetic inference by the maximum likelihood method. However, no analytical formula for estimating d has been derived for this model.
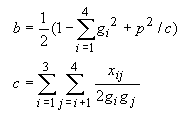
Tamura and Nei (1993) noted that model F in Table 4.1 is more realistic than model E. In model E, a1 = a2 is assumed, but actual data indicates that the rates of transitional substitution between purines (A and G) and between pyrimidines (T and C) are often different. For model F, Tamura and Nei (1993) derived the following formula for estimating d.
 | (4.26) |
They also derived the variance of d, but we are not going to present it here because it is somewhat complicated. The computation of the variance is included in the computer program.
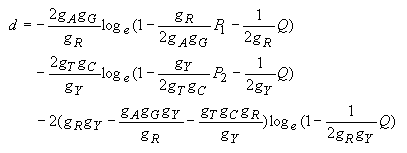
The estimates of the numbers of transitional (s) and transversional (v) substitutions per site are obtained by the following equations.
Transitional substitutions:
 | (4.27) |
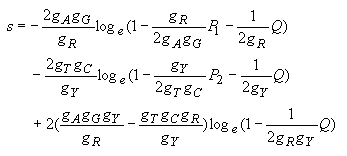
Transversional substitutions:
 | (4.28) |
The transition/transversion ratio is given by R = s/v. The computation of this ratio and its variance as well as the variances of s and v is included in MEGA.
In the distance measures discussed so far, the rate of nucleotide substitution is assumed to be the same for all nucleotide sites. In actual data this assumption rarely holds, and the rate varies from site to site. Statistical analyses of the distribution of the number of substitutions at different sites have suggested that the rate varies approximately according to the gamma distribution (Uzzell and Corbin 1971, Kocher and Wilson 1991, Tamura and Nei 1993, Wakeley 1993). The gamma distribution can be specified by the parameter a, which is the inverse of the coefficient of variation of the substitution rate (l). The smaller the parameter a, the higher the extent of variation in l. In one hypervariable segment of the control region of mitochondrial DNA, a has been estimated to be 0.47 (Wakeley 1993), whereas Uzzell and Corbin (1971) obtained a = 2 for amino acid sequence data for cytochrome c.
In the following gamma distances the rate of nucleotide substitution is assumed to follow the gamma distribution specified by parameter a. They are due to Jin and Nei (1990) and Tamura and Nei (1993). The default option of MEGA assumes a = 1.0 for nucleotide substitution, except for the gamma distance for the Tamura-Nei model. When a is small (a < 1) and the number of nucleotides examined is small (n < 100), the following formula tends to give underestimates of the true number of nucleotide substitutions (Rzhetsky and Nei 1994). It is therefore important to use a large number of nucleotides.
Gamma distance for the Jukes-Cantor model:
When the rate of substitution in the Jukes-Cantor model varies with the gamma distribution, the gamma distance and its variance are given by
| d = 3a[(1 - 4p/3)-1/a - 1]/4, | (4.29) |
| V(d) = p(1 -p)[(1 - 4p/3)-2(1/a + 1)]/n. | (4.30) |
Gamma distance for the Kimura's 2-parameter model:
In this case the gamma distance and its variance are given by
| d = (a/2)[(1 - 2P - Q)-1/a + (1/2)(1 - 2Q)-1/a - 3/2], | (4.31) |
| V(d) = (c12P + c32Q - (c1P + c3Q)2)/n, | (4.32) |
Transitional substitutions:
| s = (a/2)[(1- 2P - Q)-1/a -(1/2)(1 - 2Q)-1/a -1/2], | (4.33) |
| V(s) = (c12P + c42Q - (c1P + c4Q)2)/n, | (4.34) |
Transversional substitutions:
| v = (a/2)[(1 - 2Q)-1/a -1], | (4.35) |
| V(v) = c22Q(1 - Q)/n. | (4.36) |
Transition/Transversion ratio (R = s/ v):
| R = [(1 - 2P - Q)-1/a -(1/2)(1 - 2Q)-1/a - l/2]/[(1 - 2Q)-1/a -1]. | (4.37) |
Gamma distance for the Tamura-Nei model:
In the control region of mammalian mitochondrial DNA, the rate of nucleotide substitution is known to vary extensively from site to site, and there is a strong transition/transversion bias. The gamma distance for the Tamura-Nei model was developed primarily for the sequence data for this region. There are two hypervariable segments (5' and 3' segments), and the middle section is highly conserved. Using human data, Kocher and Wilson (1990) and Tamura and Nei (1993) estimated that a is about 0.11 for the entire control region, whereas Wakeley (1993) obtained a = 0.47 for the 5' hypervariable segment. Since most investigators use only the 5' hypervariable segment, we have decided to use a = 0.5 for the default option of MEGA. The gamma distance for the Tamura-Nei model is given by
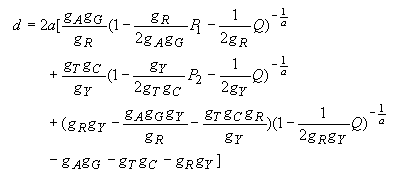 | (4.38) |
Nucleotide substitutions in coding genes can be subdivided into two classes, i.e., synonymous and nonsynonymous substitutions. Synonymous (or silent) substitutions are the nucleotide substitutions that do not result in amino acid changes, whereas nonsynonymous substitutions are those that change amino acids. The former substitutions are likely to be subject to little purifying selection except in lower organisms (however, see Britten 1993), while a majority of nonsynonymous changes are eliminated by purifying selection. Therefore, the rate of synonymous substitution is usually higher than that of nonsynonymous substitution (Miyata et al. 1980, Kimura 1983). Under certain conditions, however, nonsynonymous substitution may be accelerated by positive Darwinian selection (Hughes and Nei 1988, Lee and Vacquier 1992, and others). It is therefore interesting to examine the number of synonymous substitutions per synonymous site and the number of nonsynonymous substitutions per nonsynonymous site.
There are several methods for estimating these numbers (Miyata and Yasunaga 1980, Li et al. 1985, and others). In MEGA, however, we have included the simple method given by Nei and Gojobori (1986), since all methods give essentially the same results unless there are strong transition/transversion and G+C content biases. In Nei and Gojobori's (1986) method the numbers of synonymous (S) and nonsynonymous (N) sites are first computed. Here synonymous and nonsynonymous sites are the sites at which synonymous and nonsynonymous substitutions potentially occur, respectively (see Nei 1987, Pp. 73-76 for the method of computation). The sum of S and N is equal to the total number of nucleotides, n, and N is usually much larger than S. The numbers of synonymous (Sd) and nonsynonymous (Nd) substitutions that have occurred between two sequences are then computed by considering all pathways of nucleotide substitution between each pair of codons compared.
Using these quantities, we can compute the proportion of synonymous (ps) and nonsynonymous (pN) nucleotide differences per synonymous and nonsynonymous site, respectively. They are
| ps = Sd/S, | (4.39) |
| pN = Nd/N, | (4.40) |
| V(ps) = ps(1 -ps)/S, | (4.41) |
| V(pN) = pN(1 -pN)/N. | (4.42) |
Approximate estimates of the number of synonymous substitutions per synonymous site (ds) and the number of nonsynonymous substitutions per nonsynonymous site (dN) can be obtained by applying the Jukes-Cantor formula.
| ds = -3loge(1 - 4ps/3)/4, | (4.43) |
| dN = - 3loge(1 - 4pN/3)/4, | (4.44) |
| V(ds) = ps(1 -ps)/[(1 - 4ps/3)2S], | (4.45) |
| V(dN) = pN(1 -pN)/[(1 - 4pN/3)2N]. | (4.46) |
Computer simulations have shown that the above equations give good estimates if there is no transition/transversion bias (Nei and Gojobori 1986). However, when this bias is large, ds tends to underestimate the true number of substitutions (Kondo et al. 1993). Li (1993) and Pamilo and Bianchi (1993) developed a method to take care of this problem. It is also possible to extend Nei and Gojobori's method to this case. We plan to include these methods in future versions of MEGA.
It should be noted that ds and dN are not reliable when ps and pN are large, say greater than 0.4, because their variances are large. In this case one may use ps and pN directly, particularly for studying positive Darwinian selection (Tanaka and Nei 1989).
In the study of adaptive evolution at the nucleotide level it is often necessary to compare the average values of ds and dN or ps and pN for a group of related sequences (e.g., Hughes and Nei 1988). In this case we have to know the variances of average ds and dN or average ps and pN. These variances can be computed by Nei and Jin's (1989) method, and this computation is implemented in MEGA.
Once these values are computed, the statistical significance of the difference (d) between average ds and dN or average ps and pN can be tested by the t-test with an infinite degrees of freedom. That is, t is given by
| t = d/s(d), | (4.47) |
The methods for estimating the number of amino acid substitutions are similar to those for estimating the number of nucleotide substitutions except that there are 20 different states for the former rather than four states. The distance measures presented below can be computed either from amino acid sequences or from the coding regions of nucleotide sequences. In MEGA nucleotide sequences are translated into amino acid sequences by using one of the four genetic code tables ("universal" code and mammalian, Drosophila, and yeast mitochondrial genetic codes). Presence of a stop codon aborts the translation process and produces an error message. The treatment of missing nucleotides (or amino acids) and alignment gaps is discussed in the following section.
As in the case for nucleotide sequences, the p-distance is merely the proportion of different amino acids between two sequences compared. Therefore, the statistical properties of this distance are the same as those of the p-distance for nucleotide sequence data.
| p = nd/n, | (4.48) |
| V(p) = p(1 - p)/n | (4.49) |
This distance is for estimating the number of amino acid substitutions per site under the assumption that the number of amino acid substitutions at each site follows the Poisson distribution. This estimator (a) and its variance are given by
| d = -loge(1 -p) | (4.50) |
| V(d) = p/[(1 -p)n], | (4.51) |
This distance is an estimate of the number of amino acid substitutions per site under the assumption that the rate of amino acid substitution varies from site to site and follows the gamma distribution with parameter a. This distance and its variance can easily be computed from Nei et al.'s (1976) work.
| d = a[(1 -p)-1/a -1], | (4.52) |
| V(d) = p[(1 -p)-(1 + 2/a)]/n. | (4.53) |
In the default option of MEGA, a = 2 is used. When a = 2 is used, d is close to Dayhoff's (1978) PAM distance per site (0.01 PAM) (Tatsuya Ota, personal communication).
In the above three sections, we have discussed various distance measures considering different situations. In general, a complex mathematical model fits data better than a simple one. However, a complex model requires the estimation of many parameters, and this increases the variance of the estimate of d. Theoretically, it is possible to choose a distance measure most appropriate for a given set of data by using certain statistical criteria. Such statistical criteria are now under investigation (Bulmer 1991, Goldman 1993, Tamura 1994), but it seems to be premature to include these model-selection methods in this version of MEGA. Without such model-selection methods, it is possible to write some guidelines for choosing distance measures for the purpose of phylogenetic inference (modified from Nei 1991). They are as follows:
Note that the above guidelines are for constructing phylogenetic trees. For estimating evolutionary times or for testing the reliability of branch lengths, unbiased estimators are better than biased estimators, though unbiased estimators may vary with the data set used.
Gaps are often inserted during the alignment of homologous regions of sequences and represent deletions or insertions (indels). These gaps introduce some complications in distance estimation. Furthermore, sites with missing information can sometimes occur because of experimental difficulties, and they create the same problems as that for gaps. In the following discussion both of these sites are treated in the same way.
In MEGA, gap sites are ignored in distance estimation, but there are two different ways to treat these sites. One way to deal with this problem is to delete all of these sites from data analysis. This option, which is called the Complete-Deletion option in MEGA, is generally desirable because different regions of DNA or amino acid sequences often evolve under different evolutionary forces. However, if the number of nucleotides involved in a gap is small and gaps are distributed more or less at random, one may compute a distance for each pair of sequences ignoring only those gaps that are involved in the comparison. This option is called the Pairwise-Deletion option. Table 4.2 illustrates the effect of these options on distance estimation with the following three sequences:
            1       10        20
   seq1     A-AC-GGAT-AGGA-ATAAA
   seq2     AT-CC?GATAA?GAAAAC-A
   seq3     ATTCC-GA?TACGATA-AGA    Total sites = 20.
Here, the alignment gaps are indicated with a hyphen (-) and the missing information sites are denoted by a question mark (?).
| Option | Sequence Data | Differences/comparisons | ||
| (1,2) | (1,3) | (2,3) | ||
| Complete-Deletion | 1. A C GA A GA A A A 2. A C GA A GA A C A 3. A C GA A GA A A A |
1/10 | 0/10 | 1/10 |
| Pairwise-Deletion | 1. A-AC-GGAT-AGGA-ATAAA 2. AT-CC?GATAA?GAAAAC-A 3. ATTCC-GA?TACGATA-AGA |
2/12 | 3/13 | 3/14 |